Market Outlook
October 03, 2016
Market Cues
Domestic Indices
Chg (%)
(Pts)
(Close)
Indian markets are likely to open on a positive note considering domestic and global
BSE Sensex
0.1
38
27,866
cues and a positive SGX Nifty also indicates a green opening for the Indian markets.
Nifty
0.2
20
8,611
Mid Cap
2.0
252
13,167
The US markets closed higher on Friday, as sentiments improved on the back of
substantial rebound by shares of Deutsche Bank. Backed by strong gain on Friday
Small Cap
2.1
266
12,781
the major indices closed the week on a positive note.
Bankex
0.6
136
22,046
The European markets rallied on Friday, erasing early losses on reports that
Deutsche bank may be near a settlement with US department of justice for $ 5.4 Bn,
Global Indices
Chg (%)
(Pts)
(Close)
which is lower than what market participants were expecting.
Dow Jones
0.9
165
18,308
Indian equity indices slumped the most on Thursday since the Brexit decision in June
Nasdaq
0.8
43
5,312
to their lowest close in more than a month, rattled by the Indian army’s attacks on
FTSE
(0.3)
(20)
6,899
the terrorist camps in Pakistan. However, on Friday the markets stabilised to some
Nikkei
(1.5)
(244)
16,450
extent. In the coming week market participants will be closely watching the outcome
of the monetary policy and hence overall markets can remain volatile.
Hang Seng
(1.9)
(442)
23,297
Shanghai Com
0.2
6
3,005
News Analysis
CIPLA gets 4 observations from US FDA for its three plants in Goa
Advances / Declines
BSE
NSE
Maruti Suzuki passenger Vehicle sales grow 31% in October
Detailed analysis on Pg2
Advances
2,050
1,341
Declines
659
292
Investor’s Ready Reckoner
Unchanged
189
48
Key Domestic & Global Indicators
Stock Watch: Latest investment recommendations on 150+ stocks
Volumes (` Cr)
Refer Pg5 onwards
BSE
3,595
Top Picks
NSE
22,115
CMP
Target
Upside
Company
Sector
Rating
(`)
(`)
(%)
Amara Raja Batteries Auto & Auto Ancillary
Buy
1,010
1,174
16.2
Net Inflows (` Cr)
Net
Mtd
Ytd
HCL Tech
IT
Buy
800
1,000
25.0
FII
3,411
9,520
50,188
Bharat Electronics
Capital Goods
Accumulate
1,245
1,414
13.6
MFs
161
1,518
11,627
Equitas Holdings
Financials
Buy
175
235
34.6
Navkar Corporation Others
Buy
186
265
42.4
Top Gainers
Price (`)
Chg (%)
More Top Picks on Pg3
Balkrisind
1,015
10.9
Key Upcoming Events
Tatacomm
566
10.0
Previous
Consensus
Date
Region
Event Description
Reading
Expectations
Rcom
46
8.8
Oct 03 Germany
PMI Manufacturing
54.30
54.30
Ibrealest
92
8.4
Oct 03 India
RBI Reverse Repo rate
6.00
6.00
Ceatltd
1,324
8.0
Oct 04 UK
PMI Manufacturing
53.30
52.10
Oct 04 India
RBI Repo rate
6.50
6.50
Oct 04 US
Initial Jobless claims
254.00
255.00
Top Losers
Price (`)
Chg (%)
Oct 05 India
RBI Cash Reserve ratio
4.00
4.00
Hindcopper
60
(3.8)
Oct 06 Germany
PMI Services
50.60
50.60
Cipla
580
(3.4)
6.(
More Events on Pg4
Gdl
252
(1.8)
Techm
420
(1.7)
Itc
242
(1.6)
As on September 30, 2016
Market Outlook
October 03, 2016
News Analysis
CIPLA gets 4 observations from US FDA for its three plants in
Goa;
Indian drug maker CIPLA has informed that it has received four observations from
US FDA for three of its manufacturing facilities in Goa. The company has not
specified the nature of the observation, however has said that the observations
were primarily procedural and in nature and the company has already responded
to it. The company has 35 state of the art manufacturing facilities for API &
Formulations in India. Several Indian Pharma companies have been getting US
FDA observations in the recent years. However, we don’t expect major impact on
CIPLA due to the above developments in the near term.
Maruti Suzuki passenger Vehicle sales grow 31% in October
Maruti Suzuki the country’s largest car maker reported a staggering 31% growth in
passenger vehicle sales during September 2016. For the month the company sold
1, 49,143 units vs 1, 13,759 units. Domestic sales were at 1,37,321 units against
1,06,083 units in the same period last year, growing by 29.4%. The growth rate is
likely to remain strong in the coming months as well due to expected off take in
the festive period.
Economic and Political News
India ratifies historic Paris climate deal at UN
Spectrum auction may close this week
Corporate News
Tata Motors to hike passenger vehicle prices
Ashok Leyland lines up 8-10 new LCV, to invest upto `400cr
SBI Chairman gets one year extension
RIL penalty to be based on gas prices when produced, says ministry
Market Outlook
October 03, 2016
Top Picks ★★★★★
Large Cap
Market Cap
CMP
Target
Upside
Company
Rationale
(` Cr)
(`)
(`)
(%)
To outpace battery industry growth due to better technological
Amara Raja Batteries
17,254
1,010
1,174
16.2
products leading to market share gains in both the
automotive OEM and replacement segments.
Uptick in defense capex by government when coupled with
Bharat Electronics
29,874
1,245
1,414
13.6
BELs strong market positioning, indicate that good times are
ahead for BEL.
The stock is trading at attractive valuations and is factoring all
HCL Tech
1,12,825
800
1,000
25.0
the bad news.
Back on the growth trend, expect a long term growth of 14%
Infosys
2,38,446
1,038
1,370
32.0
to be a US$20bn in FY2020.
Source: Company, Angel Research
Mid Cap
Market Cap
CMP
Target
Upside
Company
Rationale
(` Cr)
(`)
(`)
(%)
Among the top 4 players in the consumer durables segment.
Bajaj Electricals
2,576
255
306
20.1
Improved profitability backed by turn around in E&P
segment. Strong order book lends earnings visibility.
With a focus on the low and medium income (LMI) consumer
Dewan Housing Finance
8,281
284
325
14.5
segment, the company has increased its presence in tier-II &
III cities where the growth opportunity is immense.
Strong loan growth backed by diversified loan portfolio and
adequate CAR. ROE & ROA likely to remain decent as risk of
Equitas Holdings
5,857
175
235
34.6
dilution remains low. Attractive valuations considering
growth.
Economic recovery to have favourable impact on advertising
& circulation revenue growth. Further, the acquisition of a
Jagran Prakashan
5,989
183
225
22.8
radio business (Radio City) would also boost the company's
revenue growth.
Speedier execution and speedier sales, strong revenue
Mahindra Lifespace
1,774
432
522
20.8
visibilty in short-to-long run, attractive valuations
Massive capacity expansion along with rail advantage at ICD
Navkar Corporation
2,653
186
265
42.4
as well CFS augurs well for the company
Strong brands and distribution network would boost growth
Siyaram Silk Mills
1,199
1,280
1,469
14.8
going ahead. Stock currently trades at an inexpensive
valuation.
Market leadership in Hindi news genre and no. 2 viewership
ranking in English news genre, exit from the radio business,
TV Today Network
1,825
306
363
18.6
and anticipated growth in ad spends by corporates to benefit
the stock.
Source: Company, Angel Research
Market Outlook
October 03, 2016
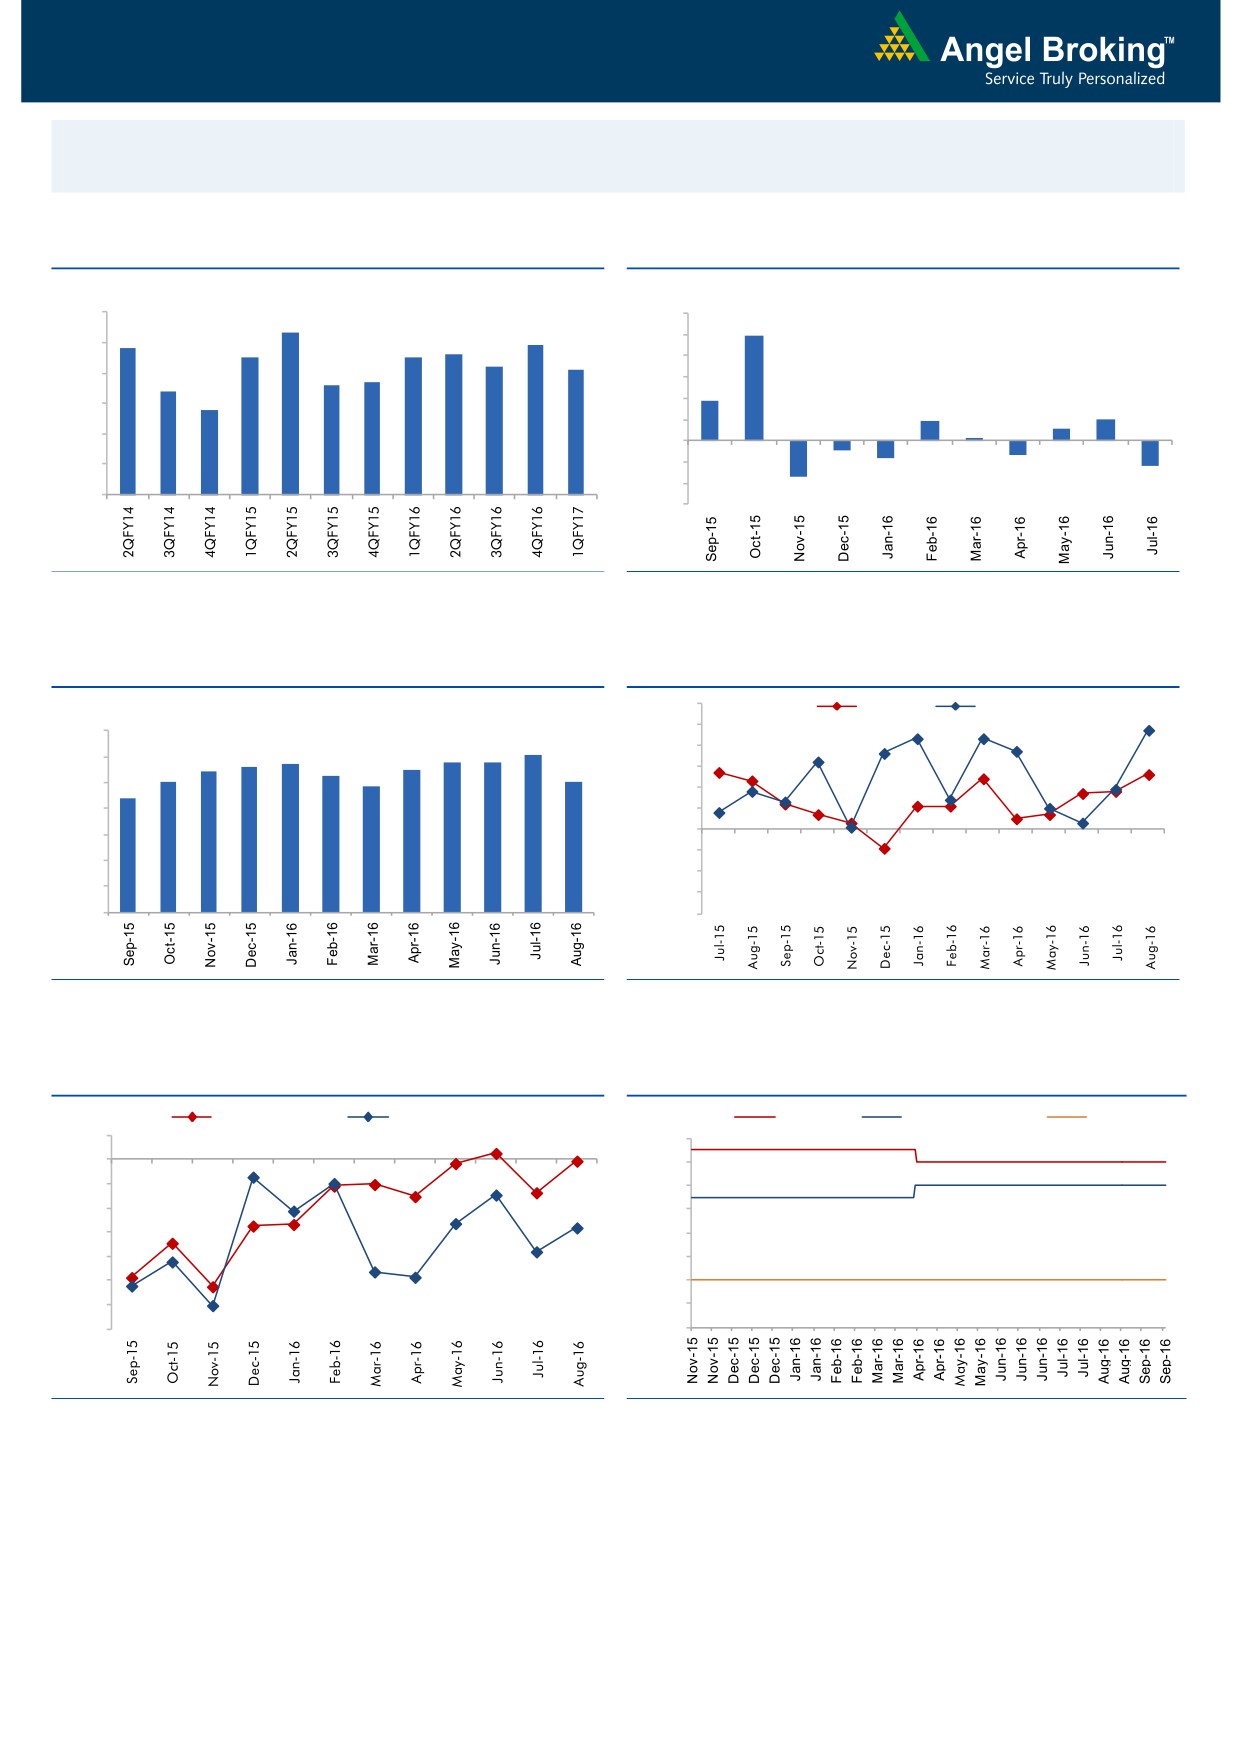
Macro watch
Exhibit 1: Quarterly GDP trends
Exhibit 2: IIP trends
(%)
(%)
9.0
12.0
8.3
9.9
7.8
7.9
8.0
7.5
7.5
7.6
10.0
7.2
7.1
8.0
6.6
6.7
7.0
6.4
6.0
3.7
5.8
6.0
4.0
1.9
2.0
1.1
2.0
0.3
5.0
-
4.0
(2.0)
(0.9)
(1.3)
(1.6)
(4.0)
(2.4)
3.0
(3.4)
(6.0)
Source: CSO, Angel Research
Source: MOSPI, Angel Research
Exhibit 3: Monthly CPI inflation trends
Exhibit 4: Manufacturing and services PMI
56.0
Mfg. PMI
Services PMI
(%)
55.0
7.0
6.1
5.7
5.8
5.8
54.0
6.0
5.4
5.6
5.5
5.0
5.3
5.1
53.0
4.8
5.0
4.4
52.0
4.0
51.0
50.0
3.0
49.0
2.0
48.0
1.0
47.0
-
46.0
Source: MOSPI, Angel Research
Source: Market, Angel Research; Note: Level above 50 indicates expansion
Exhibit 5: Exports and imports growth trends
Exhibit 6: Key policy rates
(%)
Exports yoy growth
Imports yoy growth
(%)
Repo rate
Reverse Repo rate
CRR
5.0
7.00
0.0
6.50
(5.0)
6.00
(10.0)
5.50
(15.0)
5.00
(20.0)
4.50
(25.0)
4.00
(30.0)
3.50
(35.0)
3.00
Source: Bloomberg, Angel Research
Source: RBI, Angel Research
Market Outlook
October 03, 2016
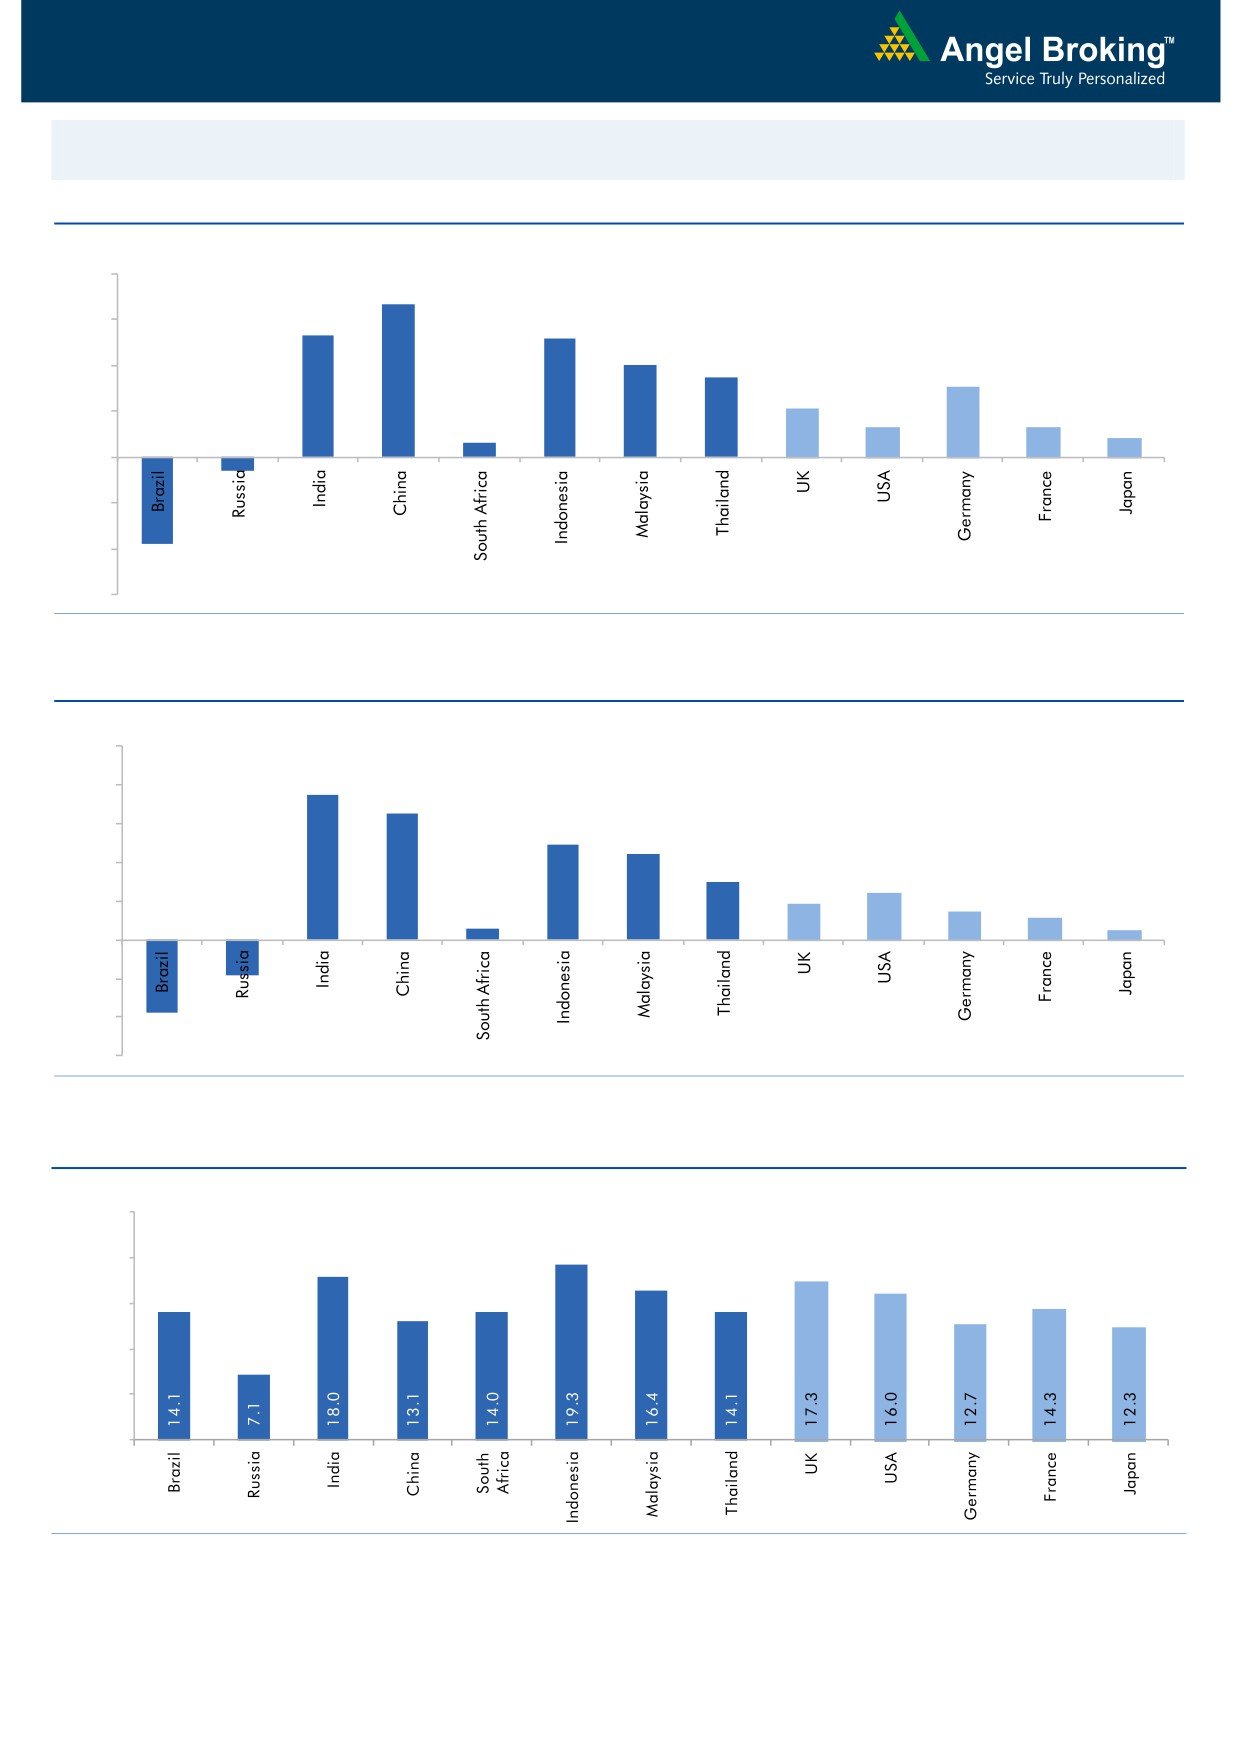
Global watch
Exhibit 1: Latest quarterly GDP Growth (%, yoy) across select developing and developed countries
(%)
8.0
6.7
6.0
5.3
0.6
5.2
4.0
3.5
4.0
3.1
2.1
2.0
1.3
1.3
0.8
-
(2.0)
(0.6)
(4.0)
(3.8)
(6.0)
Source: Bloomberg, Angel Research
Exhibit 2: 2016 GDP Growth projection by IMF (%, yoy) across select developing and developed countries
(%)
10.0
7.5
8.0
6.5
6.0
4.9
4.4
4.0
3.0
2.4
1.9
1.5
2.0
1.1
0.6
0.5
(3.8)
(1.8)
-
(2.0)
(4.0)
(6.0)
Source: IMF, Angel Research
Exhibit 3: One year forward P-E ratio across select developing and developed countries
(x)
25.0
20.0
15.0
10.0
5.0
-
Source: IMF, Angel Research
Market Outlook
October 03, 2016
Exhibit 4: Relative performance of indices across globe
Returns (%)
Country
Name of index
Closing price
1M
3M
1YR
Brazil
Bovespa
58,367
(0.4)
11.7
30.2
Russia
Micex
1,978
0.3
3.7
20.4
India
Nifty
8,611
0.0
5.9
10.2
China
Shanghai Composite
3,005
(2.1)
2.6
(5.7)
South Africa
Top 40
45,426
(1.8)
(1.2)
1.2
Mexico
Mexbol
47,246
(0.8)
2.2
10.6
Indonesia
LQ45
922
(0.1)
11.0
24.6
Malaysia
KLCI
1,653
(1.8)
1.4
1.1
Thailand
SET 50
944
(4.0)
4.4
4.3
USA
Dow Jones
18,308
(0.8)
2.1
11.1
UK
FTSE
6,899
1.7
4.9
9.5
Japan
Nikkei
16,450
(1.7)
7.4
(10.8)
Germany
DAX
10,511
(0.8)
8.3
6.1
France
CAC
4,448
0.2
5.0
(5.4)
Source: Bloomberg, Angel Research
Stock Watch
October 03, 2016
Company Name
Reco
CMP
Target
Mkt Cap
Sales ( Čcr )
OPM(%)
EPS (Č)
PER(x)
P/BV(x)
RoE(%)
EV/Sales(x)
(Č)
Price ( Č)
( Č cr )
FY17E FY18E
FY17E
FY18E
FY17E
FY18E
FY17E
FY18E
FY17E
FY18E
FY17E
FY18E
FY17E
FY18E
Agri / Agri Chemical
Rallis
Neutral
223
-
4,336
1,937
2,164
13.3
14.3
9.0
11.0
24.8
20.3
4.3
3.8
18.4
19.8
2.2
2.0
United Phosphorus
Neutral
674
-
34,156
15,176
17,604
18.5
18.5
37.4
44.6
18.0
15.1
3.5
2.9
21.4
21.2
2.4
2.0
Auto & Auto Ancillary
Ashok Leyland
Buy
80
111
22,653
22,407
26,022
10.6
10.6
5.2
6.4
15.3
12.4
3.5
2.9
23.6
24.7
1.2
1.0
Bajaj Auto
Neutral
2,832
-
81,953
25,093
27,891
19.5
19.2
143.9
162.5
19.7
17.4
5.5
4.7
30.3
29.4
3.1
2.7
Bharat Forge
Neutral
912
-
21,223
7,726
8,713
20.5
21.2
35.3
42.7
25.8
21.4
4.8
4.3
18.9
20.1
2.8
2.4
Eicher Motors
Neutral
24,828
-
67,435
16,583
20,447
17.5
18.0
598.0
745.2
41.5
33.3
14.2
10.8
41.2
38.3
3.6
2.9
Gabriel India
Neutral
116
-
1,669
1,544
1,715
9.0
9.3
5.4
6.3
21.5
18.4
4.1
3.6
18.9
19.5
1.1
0.9
Hero Motocorp
Neutral
3,414
-
68,180
31,253
35,198
15.3
15.0
172.3
192.1
19.8
17.8
7.3
6.2
38.9
37.0
2.1
1.9
Jamna Auto Industries Neutral
209
-
1,667
1,486
1,620
9.8
9.9
15.0
17.2
13.9
12.1
3.0
2.6
21.8
21.3
1.3
1.2
L G Balakrishnan & Bros Neutral
563
-
883
1,302
1,432
11.6
11.9
43.7
53.0
12.9
10.6
1.8
1.7
13.8
14.2
0.8
0.7
Mahindra and Mahindra Neutral
1,406
-
87,322
46,534
53,077
11.6
11.7
67.3
78.1
20.9
18.0
3.4
3.0
15.4
15.8
1.9
1.6
Maruti
Neutral
5,479
-
165,516
69,186
82,217
14.7
14.4
198.5
241.4
27.6
22.7
5.4
4.4
20.2
20.0
2.1
1.7
Minda Industries
Neutral
291
-
2,305
2,728
3,042
9.0
9.1
68.2
86.2
4.3
3.4
1.0
0.8
23.8
24.3
0.9
0.8
Motherson Sumi
Neutral
318
-
44,579
45,896
53,687
7.8
8.3
13.0
16.1
24.4
19.7
7.9
6.3
34.7
35.4
1.0
0.8
Rane Brake Lining
Neutral
1,166
-
923
511
562
11.3
11.5
28.1
30.9
41.5
37.7
6.3
5.8
15.3
15.0
2.1
1.9
Setco Automotive
Neutral
42
-
560
741
837
13.0
13.0
15.2
17.0
2.8
2.5
0.5
0.4
15.8
16.3
1.2
1.1
Tata Motors
Neutral
535
-
154,393
300,209
338,549
8.9
8.4
42.7
54.3
12.5
9.9
2.0
1.7
15.6
17.2
0.6
0.6
TVS Motor
Neutral
366
-
17,369
13,390
15,948
6.9
7.1
12.8
16.5
28.7
22.1
7.1
5.6
26.3
27.2
1.2
1.0
Amara Raja Batteries
Buy
1,010
1,174
17,254
5,429
6,471
17.5
17.6
35.3
43.5
28.6
23.2
6.6
5.3
25.3
24.8
3.0
2.5
Exide Industries
Neutral
183
-
15,576
7,439
8,307
15.0
15.0
8.1
9.3
22.6
19.7
3.2
2.8
14.3
16.7
1.8
1.6
Apollo Tyres
Neutral
220
-
11,209
12,877
14,504
14.3
13.9
21.4
23.0
10.3
9.6
1.6
1.4
16.4
15.2
1.0
1.0
Ceat
Neutral
1,324
-
5,356
7,524
8,624
13.0
12.7
131.1
144.3
10.1
9.2
1.9
1.6
19.8
18.6
0.7
0.6
JK Tyres
Neutral
148
-
3,359
7,455
8,056
15.0
15.0
21.8
24.5
6.8
6.0
1.4
1.2
22.8
21.3
0.6
0.5
Swaraj Engines
Neutral
1,184
-
1,471
660
810
15.2
16.4
54.5
72.8
21.7
16.3
6.8
6.1
31.5
39.2
2.1
1.7
Subros
Neutral
127
-
765
1,488
1,681
11.7
11.9
6.4
7.2
19.9
17.8
2.1
1.9
10.8
11.4
0.8
0.7
Indag Rubber
Neutral
177
-
464
286
326
19.8
16.8
11.7
13.3
15.1
13.3
2.6
2.4
17.8
17.1
1.3
1.1
Capital Goods
ACE
Neutral
44
-
430
709
814
4.1
4.6
1.4
2.1
31.1
20.7
1.3
1.2
4.4
6.0
0.8
0.7
BEML
Buy
877
1,157
3,650
3,451
4,055
6.3
9.2
31.4
57.9
27.9
15.1
1.7
1.5
6.3
10.9
1.2
1.0
Bharat Electronics
Accumulate
1,245
1,414
29,874
8,137
9,169
16.8
17.2
58.7
62.5
21.2
19.9
3.3
2.9
44.6
46.3
2.6
2.4
Stock Watch
October 03, 2016
Company Name
Reco
CMP
Target
Mkt Cap
Sales ( Čcr )
OPM(%)
EPS (Č)
PER(x)
P/BV(x)
RoE(%)
EV/Sales(x)
(Č)
Price ( Č)
( Č cr )
FY17E
FY18E
FY17E
FY18E
FY17E
FY18E
FY17E
FY18E
FY17E
FY18E
FY17E
FY18E
FY17E
FY18E
Capital Goods
Voltas
Neutral
380
-
12,557
6,511
7,514
7.9
8.7
12.9
16.3
29.4
23.3
5.3
4.6
16.7
18.5
1.7
1.5
BGR Energy
Neutral
110
-
793
16,567
33,848
6.0
5.6
7.8
5.9
14.1
18.6
0.8
0.8
4.7
4.2
0.2
0.1
BHEL
Neutral
135
-
32,957
28,797
34,742
-
2.8
2.3
6.9
58.5
19.5
1.0
1.0
1.3
4.8
0.9
0.6
Blue Star
Accumulate
550
578
5,248
4,351
5,024
6.4
7.1
17.2
20.6
32.1
26.7
20.9
17.4
23.1
24.1
1.2
1.0
Crompton Greaves
Neutral
75
-
4,713
5,777
6,120
5.9
7.0
3.3
4.5
22.8
16.7
1.0
1.0
4.4
5.9
0.8
0.7
Greaves Cotton
Neutral
130
-
3,171
1,755
1,881
16.8
16.9
7.8
8.5
16.7
15.3
3.3
3.1
20.6
20.9
1.5
1.4
Inox Wind
Buy
200
286
4,444
5,605
6,267
15.7
16.4
24.8
30.0
8.1
6.7
2.3
1.7
25.9
24.4
0.8
0.7
KEC International
Neutral
125
-
3,223
9,294
10,186
7.9
8.1
9.9
11.9
12.7
10.5
1.9
1.6
15.6
16.3
0.6
0.5
Thermax
Neutral
845
-
10,063
5,421
5,940
7.3
7.3
25.7
30.2
32.9
28.0
4.0
3.6
12.2
13.1
1.8
1.7
VATech Wabag
Buy
549
681
2,995
3,136
3,845
8.9
9.1
26.0
35.9
21.1
15.3
2.6
2.3
13.4
15.9
0.9
0.7
Cement
ACC
Neutral
1,595
-
29,951
11,225
13,172
13.2
16.9
44.5
75.5
35.8
21.1
3.4
3.1
11.2
14.2
2.8
2.4
Ambuja Cements
Neutral
253
-
50,197
9,350
10,979
18.2
22.5
5.8
9.5
43.6
26.6
3.7
3.3
10.2
12.5
5.7
4.8
India Cements
Neutral
144
-
4,419
4,364
4,997
18.5
19.2
7.9
11.3
18.2
12.7
1.3
1.3
8.0
8.5
1.8
1.6
JK Cement
Neutral
875
-
6,116
4,398
5,173
15.5
17.5
31.2
55.5
28.0
15.8
3.4
2.9
12.0
15.5
1.8
1.5
J K Lakshmi Cement
Neutral
497
-
5,845
2,913
3,412
14.5
19.5
7.5
22.5
66.2
22.1
4.1
3.4
12.5
18.0
2.5
2.1
Orient Cement
Neutral
215
-
4,405
2,114
2,558
18.5
20.5
8.1
11.3
26.5
19.0
3.9
3.3
9.0
14.0
2.6
2.0
UltraTech Cement
Neutral
3,858
-
105,875
25,768
30,385
21.0
23.5
111.0
160.0
34.8
24.1
4.4
3.9
13.5
15.8
4.3
3.6
Construction
ITNL
Neutral
100
-
3,293
8,946
10,017
31.0
31.6
8.1
9.1
12.4
11.0
0.5
0.5
4.2
5.0
3.7
3.5
KNR Constructions
Accumulate
753
802
2,117
1,385
1,673
14.7
14.0
41.2
48.5
18.3
15.5
3.4
2.9
14.9
15.2
1.5
1.2
Larsen & Toubro
Accumulate
1,432
1,700
133,431
67,665
77,249
10.7
11.5
57.3
71.2
25.0
20.1
2.3
2.2
12.6
14.3
2.2
1.9
Gujarat Pipavav Port
Neutral
174
-
8,431
705
788
52.2
51.7
5.0
5.6
34.9
31.1
3.4
3.1
11.2
11.2
11.8
10.1
Nagarjuna Const.
Neutral
82
-
4,567
8,842
9,775
9.1
8.8
5.3
6.4
15.5
12.8
1.2
1.1
8.2
9.1
0.7
0.6
PNC Infratech
Buy
116
143
2,984
2,350
2,904
13.1
13.2
9.0
8.8
12.9
13.2
0.5
0.4
15.9
13.9
1.5
1.2
Simplex Infra
Neutral
328
-
1,624
6,829
7,954
10.5
10.5
31.4
37.4
10.5
8.8
1.1
1.0
9.9
13.4
0.7
0.6
Power Mech Projects
Neutral
486
-
715
1,801
2,219
12.7
14.6
72.1
113.9
6.7
4.3
1.2
1.1
16.8
11.9
0.4
0.3
Sadbhav Engineering
Neutral
281
-
4,826
3,598
4,140
10.3
10.6
9.0
11.9
31.3
23.6
3.3
2.9
9.9
11.9
1.7
1.4
NBCC
Neutral
252
-
15,105
7,428
9,549
7.9
8.6
8.2
11.0
30.7
22.9
1.5
1.2
28.2
28.7
1.8
1.3
MEP Infra
Neutral
41
-
664
1,877
1,943
30.6
29.8
3.0
4.2
13.6
9.7
6.6
4.4
0.6
0.6
1.8
1.6
SIPL
Neutral
108
-
3,797
1,036
1,252
65.5
66.2
(8.4)
(5.6)
4.0
4.6
(22.8)
(15.9)
11.8
9.8
Stock Watch
October 03, 2016
Company Name
Reco
CMP
Target
Mkt Cap
Sales ( Čcr )
OPM(%)
EPS (Č)
PER(x)
P/BV(x)
RoE(%)
EV/Sales(x)
(Č)
Price ( Č)
( Č cr )
FY17E
FY18E
FY17E
FY18E
FY17E
FY18E
FY17E
FY18E
FY17E
FY18E
FY17E
FY18E
FY17E
FY18E
Construction
Engineers India
Neutral
248
-
8,371
1,725
1,935
16.0
19.1
11.4
13.9
21.8
17.9
3.0
2.9
13.4
15.3
4.1
3.7
Financials
Axis Bank
Neutral
542
-
129,326
58,081
66,459
3.5
3.5
32.4
44.6
16.8
12.1
2.2
1.9
13.6
16.5
-
-
Bank of Baroda
Neutral
167
-
38,549
19,980
23,178
1.8
1.8
11.5
17.3
14.6
9.7
1.7
1.4
8.3
10.1
-
-
Canara Bank
Neutral
308
-
16,743
15,225
16,836
1.8
1.8
14.5
28.0
21.3
11.0
1.5
1.2
5.8
8.5
-
-
Dewan Housing Finance Accumulate
284
325
8,281
2,225
2,688
2.9
2.9
29.7
34.6
9.6
8.2
1.5
1.3
16.1
16.8
-
-
Equitas Holdings
Buy
175
235
5,857
939
1,281
11.7
11.5
5.8
8.2
30.1
21.3
2.6
2.3
10.9
11.5
-
-
Federal Bank
Neutral
72
-
12,362
9,353
10,623
2.9
2.9
4.4
5.8
16.4
12.4
1.6
1.4
9.5
11.0
-
-
HDFC
Neutral
1,393
-
220,236
11,475
13,450
3.4
3.4
45.3
52.5
30.8
26.5
5.9
5.2
20.2
20.5
-
-
HDFC Bank
Neutral
1,272
-
321,962
46,097
55,433
4.5
4.5
58.4
68.0
21.8
18.7
3.8
3.2
18.8
18.6
-
-
ICICI Bank
Neutral
252
-
146,761
39,029
45,903
3.3
3.3
16.7
16.3
15.1
15.5
1.9
1.7
10.1
12.4
-
-
LIC Housing Finance
Neutral
579
-
29,233
3,712
4,293
2.6
2.5
39.0
46.0
14.9
12.6
2.8
2.4
19.9
20.1
-
-
Punjab Natl.Bank
Neutral
141
-
29,930
23,532
23,595
2.3
2.4
6.8
12.6
20.7
11.2
3.2
2.3
3.3
6.5
-
-
RBL Bank
Accumulate
291
325
10,769
1,783
2,309
2.6
2.6
12.7
16.4
22.9
17.8
2.5
2.2
12.8
13.3
-
-
South Ind.Bank
Neutral
22
-
2,950
6,435
7,578
2.5
2.5
2.7
3.1
8.1
7.1
1.0
0.9
10.1
11.2
-
-
St Bk of India
Neutral
251
-
194,613
88,650
98,335
2.6
2.6
13.5
18.8
18.6
13.3
1.8
1.6
7.0
8.5
-
-
Union Bank
Neutral
138
-
9,459
13,450
14,925
2.3
2.3
25.5
34.5
5.4
4.0
0.8
0.7
7.5
10.2
-
-
Yes Bank
Neutral
1,254
-
52,804
8,978
11,281
3.3
3.4
74.0
90.0
17.0
13.9
3.2
2.7
17.0
17.2
-
-
FMCG
Asian Paints
Neutral
1,162
-
111,468
17,128
18,978
16.8
16.4
19.1
20.7
60.8
56.1
21.2
20.0
34.8
35.5
6.4
5.8
Britannia
Neutral
3,367
-
40,393
9,795
11,040
14.6
14.9
80.3
94.0
41.9
35.8
17.2
13.3
41.2
-
4.0
3.5
Colgate
Neutral
971
-
26,407
4,605
5,149
23.4
23.4
23.8
26.9
40.8
36.1
22.6
17.7
64.8
66.8
5.6
5.0
Dabur India
Neutral
271
-
47,726
8,315
9,405
19.8
20.7
8.1
9.2
33.5
29.5
9.3
7.7
31.6
31.0
5.9
5.2
GlaxoSmith Con*
Neutral
6,010
-
25,273
4,350
4,823
21.2
21.4
179.2
196.5
33.5
30.6
8.9
7.5
27.1
26.8
5.4
4.8
Godrej Consumer
Neutral
1,584
-
53,947
10,235
11,428
18.4
18.6
41.1
44.2
38.6
35.8
8.6
7.2
24.9
24.8
5.6
4.9
HUL
Neutral
868
-
187,813
35,252
38,495
17.6
17.4
20.4
21.9
42.5
39.6
34.9
30.6
82.2
77.3
5.4
5.0
ITC
Accumulate
242
283
291,570
40,059
44,439
39.0
39.2
9.1
10.1
26.6
23.9
7.2
6.4
27.2
26.5
7.3
6.5
Marico
Neutral
275
-
35,506
6,430
7,349
18.8
19.5
6.4
7.7
43.0
35.7
13.0
10.9
33.2
32.5
5.7
4.9
Nestle*
Neutral
6,428
-
61,978
10,073
11,807
20.7
21.5
124.8
154.2
51.5
41.7
21.2
19.0
34.8
36.7
5.9
5.0
Tata Global
Neutral
140
-
8,811
8,675
9,088
9.8
9.8
7.4
8.2
18.9
17.0
2.1
2.1
7.9
8.1
0.9
0.9
Procter & Gamble
Accumulate
6,805
7,369
22,090
2,939
3,342
23.2
23.0
146.2
163.7
46.6
41.6
104.2
99.9
25.3
23.5
7.0
6.1
Hygiene
Stock Watch
October 03, 2016
Company Name
Reco
CMP
Target
Mkt Cap
Sales ( Čcr )
OPM(%)
EPS (Č)
PER(x)
P/BV(x)
RoE(%)
EV/Sales(x)
(Č)
Price ( Č)
( Č cr )
FY17E FY18E
FY17E
FY18E
FY17E
FY18E
FY17E
FY18E
FY17E
FY18E
FY17E
FY18E
FY17E
FY18E
IT
HCL Tech^
Buy
800
1,000
112,825
49,242
57,168
20.5
20.5
55.7
64.1
14.4
12.5
2.9
2.2
20.3
17.9
2.1
1.7
Infosys
Buy
1,038
1,370
238,446
69,934
79,025
27.5
27.5
64.8
72.0
16.0
14.4
3.5
3.2
22.0
22.3
2.9
2.5
TCS
Buy
2,427
3,004
478,262
121,684
136,286
27.3
27.3
135.0
150.1
18.0
16.2
6.0
5.5
33.2
33.9
3.7
3.2
Tech Mahindra
Buy
420
700
40,764
30,347
33,685
17.0
17.0
37.5
41.3
11.2
10.2
2.4
2.1
21.8
20.7
1.2
1.0
Wipro
Buy
478
680
116,104
51,631
55,822
21.7
17.9
35.9
36.9
13.3
12.9
2.8
2.6
19.0
18.1
2.0
1.7
Media
D B Corp
Neutral
394
-
7,240
2,297
2,590
27.4
28.2
21.0
23.4
18.8
16.8
4.4
3.8
23.7
23.1
3.0
2.6
HT Media
Neutral
83
-
1,936
2,693
2,991
12.6
12.9
7.9
9.0
10.5
9.2
0.9
0.8
7.8
8.3
0.3
0.2
Jagran Prakashan
Buy
183
225
5,989
2,355
2,635
28.0
28.0
10.8
12.5
17.0
14.7
3.7
3.2
21.7
21.7
2.6
2.3
Sun TV Network
Neutral
505
-
19,915
2,850
3,265
70.1
71.0
26.2
30.4
19.3
16.6
4.9
4.4
24.3
25.6
6.4
5.4
Hindustan Media
Neutral
287
-
2,104
1,016
1,138
24.3
25.2
27.3
30.1
10.5
9.5
2.0
1.8
16.2
15.8
1.4
1.2
Ventures
TV Today Network
Buy
306
363
1,825
637
743
27.5
27.5
18.4
21.4
16.7
14.3
2.9
2.5
17.4
17.2
2.5
2.1
Metals & Mining
Coal India
Neutral
323
-
203,734
84,638
94,297
21.4
22.3
24.5
27.1
13.2
11.9
5.5
5.2
42.6
46.0
2.0
1.8
Hind. Zinc
Neutral
233
-
98,556
14,252
18,465
55.9
48.3
15.8
21.5
14.8
10.9
2.4
2.1
17.0
20.7
6.4
5.0
Hindalco
Neutral
153
-
31,563
107,899
112,095
7.4
8.2
9.2
13.0
16.6
11.8
0.8
0.8
4.8
6.6
0.8
0.7
JSW Steel
Neutral
1,732
-
41,858
53,201
58,779
16.1
16.2
130.6
153.7
13.3
11.3
1.8
1.6
14.0
14.4
1.6
1.4
NMDC
Neutral
106
-
41,907
6,643
7,284
44.4
47.7
7.1
7.7
14.9
13.7
1.3
1.3
8.8
9.2
3.9
3.5
SAIL
Neutral
46
-
19,143
47,528
53,738
(0.7)
2.1
(1.9)
2.6
17.8
0.5
0.5
(1.6)
3.9
1.3
1.1
Vedanta
Neutral
172
-
51,008
71,744
81,944
19.2
21.7
13.4
20.1
12.8
8.6
1.1
1.0
8.4
11.3
1.1
0.8
Tata Steel
Neutral
374
-
36,362
121,374
121,856
7.2
8.4
18.6
34.3
20.1
10.9
1.3
1.2
6.1
10.1
0.9
0.9
Oil & Gas
Cairn India
Neutral
200
-
37,535
9,127
10,632
4.3
20.6
8.8
11.7
22.8
17.1
0.7
0.7
3.3
4.2
5.4
4.5
GAIL
Neutral
374
-
47,447
56,220
65,198
9.3
10.1
27.1
33.3
13.8
11.2
1.3
1.2
9.3
10.7
1.1
0.9
ONGC
Neutral
257
-
219,619
137,222
152,563
15.0
21.8
19.5
24.1
13.2
10.7
1.1
1.1
8.5
10.1
1.9
1.7
Indian Oil Corp
Neutral
583
-
141,428
373,359
428,656
5.9
5.5
54.0
59.3
10.8
9.8
1.7
1.5
16.0
15.6
0.5
0.4
Reliance Industries
Neutral
1,082
-
350,865
301,963
358,039
12.1
12.6
87.7
101.7
12.3
10.6
1.3
1.2
10.7
11.3
1.6
1.4
Pharmaceuticals
Alembic Pharma
Neutral
655
-
12,353
3,483
4,083
20.2
21.4
24.3
30.4
27.0
21.6
6.1
4.9
25.5
25.3
3.4
2.9
Aurobindo Pharma
Accumulate
855
877
50,026
15,720
18,078
23.7
23.7
41.4
47.3
20.7
18.1
5.4
4.2
29.6
26.1
3.2
2.8
Aventis*
Neutral
4,157
-
9,574
2,357
2,692
17.3
17.3
153.5
169.2
27.1
24.6
4.6
3.7
25.8
28.4
3.9
3.2
Cadila Healthcare
Neutral
388
-
39,721
11,126
13,148
22.0
22.0
17.1
20.0
22.7
19.4
5.8
4.6
28.8
26.6
3.6
2.9
Cipla
Sell
580
490
46,627
15,378
18,089
17.4
18.4
21.6
27.2
26.9
21.3
3.5
3.0
13.7
15.2
3.3
2.8
Stock Watch
October 03, 2016
Company Name
Reco
CMP
Target
Mkt Cap
Sales ( Čcr )
OPM(%)
EPS (Č)
PER(x)
P/BV(x)
RoE(%)
EV/Sales(x)
(Č)
Price ( Č)
( Č cr )
FY17E FY18E
FY17E
FY18E
FY17E
FY18E
FY17E
FY18E
FY17E
FY18E
FY17E
FY18E
FY17E
FY18E
Pharmaceuticals
Dr Reddy's
Neutral
3,109
-
51,510
16,043
18,119
23.1
24.7
126.0
157.8
24.7
19.7
3.6
3.1
15.7
17.1
3.2
2.8
Dishman Pharma
Sell
259
45
4,180
1,718
1,890
22.7
22.8
9.5
11.3
27.3
22.9
2.6
2.4
10.1
10.9
2.3
2.0
GSK Pharma*
Neutral
2,782
-
23,563
3,528
3,811
16.6
18.8
51.8
59.4
53.7
46.8
14.4
14.3
26.3
30.6
6.6
6.1
Indoco Remedies
Sell
313
225
2,887
1,112
1,289
18.2
18.2
13.2
15.6
23.7
20.1
4.2
3.6
19.2
19.2
2.8
2.4
Ipca labs
Neutral
599
-
7,556
3,303
3,799
15.3
15.3
17.3
19.7
34.6
30.4
3.0
2.8
9.1
9.4
2.4
2.1
Lupin
Buy
1,485
1,809
66,970
15,912
18,644
26.4
26.7
58.1
69.3
25.6
21.4
5.0
4.1
21.4
20.9
4.4
3.7
Sun Pharma
Buy
743
944
178,745
31,129
35,258
30.0
30.9
28.0
32.8
26.5
22.6
4.1
3.4
18.7
18.9
5.6
4.8
Power
Tata Power
Neutral
75
-
20,393
36,916
39,557
17.4
27.1
5.1
6.3
14.8
12.0
1.3
1.2
9.0
10.3
1.6
1.4
NTPC
Neutral
149
-
122,445
86,605
95,545
17.5
20.8
11.8
13.4
12.6
11.1
1.3
1.2
10.5
11.1
2.8
2.8
Power Grid
Neutral
176
-
92,259
25,763
29,762
74.3
73.1
14.8
17.3
11.9
10.2
1.9
1.6
16.9
17.5
7.9
7.5
Real Estate
Prestige Estate
Accumulate
193
210
7,228
4,707
5,105
25.2
26.0
10.3
13.0
18.7
14.8
1.5
1.4
10.3
10.2
2.7
2.4
MLIFE
Buy
432
522
1,774
1,152
1,300
22.7
24.6
29.9
35.8
14.5
12.1
1.1
1.0
7.6
8.6
2.3
1.9
Telecom
Bharti Airtel
Neutral
314
-
125,538
105,086
114,808
34.5
34.7
12.2
16.4
25.7
19.2
1.7
1.6
6.8
8.4
2.1
1.9
Idea Cellular
Neutral
79
-
28,536
40,133
43,731
37.2
37.1
6.4
6.5
12.4
12.2
1.0
1.0
8.2
7.6
1.8
1.5
zOthers
Abbott India
Neutral
4,723
-
10,036
3,153
3,583
14.1
14.4
152.2
182.7
31.0
25.9
152.4
130.1
25.6
26.1
2.9
2.5
Bajaj Electricals
Buy
255
306
2,576
5,099
5,805
5.6
5.9
11.4
14.6
22.4
17.5
3.0
2.7
13.4
15.1
0.5
0.5
Finolex Cables
Neutral
442
-
6,757
2,883
3,115
12.0
12.1
14.2
18.6
31.1
23.8
16.6
14.5
15.8
14.6
2.0
1.8
Goodyear India*
Accumulate
689
684
1,590
1,598
1,704
10.4
10.2
49.4
52.6
14.0
13.1
64.4
56.5
18.2
17.0
0.6
82.8
Hitachi
Neutral
1,623
-
4,414
2,081
2,433
8.8
8.9
33.4
39.9
48.6
40.7
39.2
32.7
22.1
21.4
1.9
1.6
Jyothy Laboratories
Neutral
344
-
6,248
1,440
2,052
11.5
13.0
8.5
10.0
40.5
34.4
9.8
9.1
18.6
19.3
4.5
3.1
Page Industries
Neutral
15,106
-
16,849
2,450
3,124
20.1
17.6
299.0
310.0
50.5
48.7
336.4
256.8
47.1
87.5
7.0
5.5
Relaxo Footwears
Neutral
448
-
5,372
2,085
2,469
9.2
8.2
7.6
8.0
59.2
56.3
23.0
19.6
17.9
18.8
2.5
2.1
Siyaram Silk Mills
Buy
1,280
1,469
1,199
1,799
2,040
11.6
11.7
104.9
122.4
12.2
10.5
2.0
1.7
16.4
16.4
0.8
0.7
Styrolution ABS India*
Neutral
581
-
1,021
1,440
1,537
9.2
9.0
40.6
42.6
14.3
13.6
36.5
33.2
12.3
11.6
0.7
0.6
TVS Srichakra
Neutral
4,027
-
3,083
2,304
2,614
13.7
13.8
231.1
266.6
17.4
15.1
452.5
356.3
33.9
29.3
1.0
0.8
HSIL
Neutral
341
-
2,462
2,384
2,515
15.8
16.3
15.3
19.4
22.3
17.6
22.1
19.0
7.8
9.3
1.2
1.1
Kirloskar Engines India
Neutral
334
-
4,835
2,554
2,800
9.9
10.0
10.5
12.1
31.8
27.6
13.3
12.6
10.7
11.7
1.4
1.2
Ltd
M M Forgings
Neutral
420
-
506
546
608
20.4
20.7
41.3
48.7
10.2
8.6
57.5
50.9
16.6
17.0
0.8
0.7
Banco Products (India)
Neutral
208
-
1,484
1,353
1,471
12.3
12.4
14.5
16.3
14.3
12.7
19.8
17.8
14.5
14.6
1.1
118.7
Stock Watch
October 03, 2016
Company Name
Reco
CMP
Target
Mkt Cap
Sales ( Čcr )
OPM(%)
EPS (Č)
PER(x)
P/BV(x)
RoE(%)
EV/Sales(x)
(Č)
Price ( Č)
( Č cr )
FY17E
FY18E
FY17E
FY18E
FY17E
FY18E
FY17E
FY18E
FY17E
FY18E
FY17E
FY18E
FY17E
FY18E
zOthers
Competent Automobiles Neutral
189
-
116
1,137
1,256
3.1
2.7
28.0
23.6
6.8
8.0
36.4
32.8
14.3
11.5
0.1
0.1
Nilkamal
Neutral
1,277
-
1,906
1,995
2,165
10.7
10.4
69.8
80.6
18.3
15.8
73.0
63.4
16.6
16.5
1.0
0.9
Visaka Industries
Neutral
186
-
296
1,051
1,138
10.3
10.4
21.0
23.1
8.9
8.1
23.9
22.4
9.0
9.2
0.6
0.5
Transport Corporation of
Neutral
186
-
1,425
2,671
2,911
8.5
8.8
13.9
15.7
13.4
11.9
1.8
1.6
13.7
13.8
0.7
0.6
India
Elecon Engineering
Neutral
58
-
631
1,482
1,660
13.7
14.5
3.9
5.8
14.9
10.0
3.5
3.2
7.8
10.9
0.8
0.7
Surya Roshni
Neutral
216
-
948
3,342
3,625
7.8
7.5
17.3
19.8
12.5
11.0
23.8
19.1
10.5
10.8
0.5
0.5
MT Educare
Neutral
130
-
518
366
417
17.7
18.2
9.4
10.8
13.9
12.0
3.1
2.7
22.2
22.3
1.4
1.2
Radico Khaitan
Buy
120
125
1,594
1,659
1,802
13.0
13.2
6.3
7.4
18.9
16.3
1.6
1.5
8.6
9.3
1.3
1.2
Garware Wall Ropes
Neutral
525
-
1,149
873
938
12.9
13.1
30.9
34.9
17.0
15.0
2.7
2.3
15.7
15.2
1.2
1.1
Wonderla Holidays
Neutral
377
-
2,130
287
355
38.0
40.0
11.3
14.2
33.4
26.6
4.8
4.2
21.4
23.9
7.3
5.9
Linc Pen & Plastics
Neutral
264
-
390
382
420
9.3
9.5
13.5
15.7
19.6
16.8
3.4
2.9
17.1
17.3
1.1
1.0
The Byke Hospitality
Neutral
180
-
722
287
384
20.5
20.5
7.6
10.7
23.7
16.8
5.0
4.0
20.7
23.5
2.3
1.7
Interglobe Aviation
Neutral
916
-
32,998
21,122
26,005
14.5
27.6
110.7
132.1
8.3
6.9
49.5
35.4
168.5
201.1
1.5
1.1
Coffee Day Enterprises
Neutral
225
-
4,637
2,964
3,260
20.5
21.2
4.7
8.0
-
28.1
2.6
2.4
5.5
8.5
2.0
1.8
Ltd
Navneet Education
Neutral
100
-
2,380
1,062
1,147
24.0
24.0
6.1
6.6
16.4
15.1
3.4
3.0
20.6
19.8
2.4
2.2
Navkar Corporation
Buy
186
265
2,653
408
612
42.9
42.3
6.8
11.5
27.5
16.2
1.9
1.7
6.9
10.5
7.9
5.2
UFO Moviez
Neutral
468
-
1,291
619
685
33.2
33.4
30.0
34.9
15.6
13.4
2.2
1.9
13.8
13.9
1.8
1.5
VRL Logistics
Neutral
300
-
2,734
1,902
2,119
16.7
16.6
14.6
16.8
20.6
17.8
4.5
4.0
21.9
22.2
1.5
1.3
Team Lease Serv.
Neutral
1,066
-
1,822
3,229
4,001
1.5
1.8
22.8
32.8
46.8
32.5
5.0
4.3
10.7
13.4
0.5
0.4
S H Kelkar & Co.
Neutral
304
-
4,393
1,036
1,160
15.1
15.0
6.1
7.2
49.7
42.3
5.3
4.9
10.7
11.5
4.2
3.7
Quick Heal
Neutral
219
-
1,533
408
495
27.3
27.0
7.7
8.8
28.3
24.9
2.6
2.6
9.3
10.6
3.0
2.5
Narayana Hrudaya
Neutral
334
-
6,816
1,873
2,166
11.5
11.7
2.6
4.0
126.1
84.1
7.7
7.0
6.1
8.3
3.6
3.1
Manpasand Bever.
Neutral
751
-
3,760
836
1,087
19.6
19.4
16.9
23.8
44.5
31.5
5.3
4.7
12.0
14.8
4.0
3.0
Parag Milk Foods
Neutral
294
-
2,471
1,919
2,231
9.3
9.6
9.5
12.9
31.1
22.7
4.8
4.0
15.5
17.5
1.6
1.4
Mirza International
Buy
97
113
1,161
1,024
1,148
18.0
18.0
6.9
8.0
14.0
12.1
2.4
2.0
16.6
16.2
1.2
1.1
Source: Company, Angel Research; Note: *December year end; #September year end; &October year end; Price as on September 30, 2016
Market Outlook
October 03, 2016
Research Team Tel: 022 - 39357800
DISCLAIMER
Angel Broking Private Limited (hereinafter referred to as “Angel”) is a registered Member of National Stock Exchange of India
Limited,Bombay Stock Exchange Limited and Metropolitan Stock Exchange Limited. It is also registered as a Depository Participant with
CDSL and Portfolio Manager with SEBI. It also has registration with AMFI as a Mutual Fund Distributor. Angel Broking Private Limited is a
registered entity with SEBI for Research Analyst in terms of SEBI (Research Analyst) Regulations, 2014 vide registration number
INH000000164. Angel or its associates has not been debarred/ suspended by SEBI or any other regulatory authority for accessing
/dealing in securities Market. Angel or its associates/analyst has not received any compensation / managed or
co-managed public offering of securities of the company covered by Analyst during the past twelve months.
This document is solely for the personal information of the recipient, and must not be singularly used as the basis of any investment
decision. Nothing in this document should be construed as investment or financial advice. Each recipient of this document should make
such investigations as they deem necessary to arrive at an independent evaluation of an investment in the securities of the companies
referred to in this document (including the merits and risks involved), and should consult their own advisors to determine the merits and
risks of such an investment.
Reports based on technical and derivative analysis center on studying charts of a stock's price movement, outstanding positions and
trading volume, as opposed to focusing on a company's fundamentals and, as such, may not match with a report on a company's
fundamentals. Investors are advised to refer the Fundamental and Technical Research Reports available on our website to evaluate the
contrary view, if any.
The information in this document has been printed on the basis of publicly available information, internal data and other reliable
sources believed to be true, but we do not represent that it is accurate or complete and it should not be relied on as such, as this
document is for general guidance only. Angel Broking Pvt. Limited or any of its affiliates/ group companies shall not be in any way
responsible for any loss or damage that may arise to any person from any inadvertent error in the information contained in this report.
Angel Broking Pvt. Limited has not independently verified all the information contained within this document. Accordingly, we cannot
testify, nor make any representation or warranty, express or implied, to the accuracy, contents or data contained within this document.
While Angel Broking Pvt. Limited endeavors to update on a reasonable basis the information discussed in this material, there may be
regulatory, compliance, or other reasons that prevent us from doing so.
This document is being supplied to you solely for your information, and its contents, information or data may not be reproduced,
redistributed or passed on, directly or indirectly.
Neither Angel Broking Pvt. Limited, nor its directors, employees or affiliates shall be liable for any loss or damage that may arise from
or in connection with the use of this information.